
Radmon.org API rate limiting and mass upload feature
- geigermantes
-
 Topic Author
- Offline
- New Member
-

Less
More
- Posts: 5
- Thank you received: 0
3 months 6 days ago #7519
by geigermantes
Radmon.org API rate limiting and mass upload feature was created by geigermantes
Hi All,
2 questions in this topic, but they are related.
First I have searched the forum for these 2 questions but did not find anything. Apologies if they are posted somewhere.
1 - It looks like there is a rate limiting feature when uploading data too frequently. I explain:
I am posting CPM values every minute and it works fine.
I also store the values in a queue, just in case the API is not available at the time of the upload.
When it is not available, I wait 10 seconds for the API to be up again and resubmit the data every 2 seconds.
This seems to work for a few values, then the API replies that it is down, then comes up again after a while, and the process starts again, except that while the API was down - for me only I guess - new values have been added in the queue.
In the end the queue does not empty itself at a constant rate and barely beats the rates it is increasing at. Not ideal.
So I changed the values, increasing the delay from 2 to 13 seconds (not a divider of 60).
This works much better as now there are no more "API not available" answers anymore and the queue is emptying itself much faster and at a constant rate.
So there must be a rate limiting feature when uploading to radmon.org (which I can totally understand).
Just wanted to know the values I would have to set to empty the queue as fast as possible without overloading the system.
Which leads me to the 2nd question:
2 - Is there a mass upload feature built in the API ?
Something where you could submit not one but many values with different timestamps in an API call, so that you don't have to call the API so often?
I have not seen that in the API specifications.
Thanks and Regards,
Please Log in or Create an account to join the conversation.
3 months 4 days ago - 3 months 4 days ago #7520
by jnissen
Replied by jnissen on topic Radmon.org API rate limiting and mass upload feature
Odd. I think my update rate is every 30 seconds. Seems to run just fine. Not sure on the mass upload feature.
Looks like there must be a limit of roughly ~10 seconds from what you tested. I think every 30 seconds is more than enough for a CPM count. The data is logged and averaged at the site so really you just want to spot trends.
Looks like there must be a limit of roughly ~10 seconds from what you tested. I think every 30 seconds is more than enough for a CPM count. The data is logged and averaged at the site so really you just want to spot trends.
Last edit: 3 months 4 days ago by jnissen.
Please Log in or Create an account to join the conversation.
3 months 4 days ago #7522
by Simomax
Replied by Simomax on topic Radmon.org API rate limiting and mass upload feature
Hi, This is by design and the minimum submission interval is no less than every 30 seconds. I hardcoded this into radmon core over 2 years ago (
see post here
) as there were some users submitting every second and there simply is no need to submit that frequently when we are dealing in counts per minute. Once a minute is ample IMHO. I sometimes will use 30 seconds submission interval when testing, so I'm not waiting too much, but that is all. I have no understanding why a 1 second resolution is needed by some people as it serves no purpose to radmon.org other than bloating the database and making it incredibly long and hard on the CPU to generate graphs, which look pretty much the same as 30 second submissions, and from what I remember the 1 seconds submissions when they were happening just gave a kind of thick fuzzy line with all the fine peaks and troughs.
If it wasn't hard on the server I wouldn't mind so much, but it is. The graphs are generated on the fly, limited by a time span (I can't remember if it is a minute or 5, or something else. I'd have to look at the core code), providing the server isn't too busy. A submission comes in --> checks last submission time. If OK --> date/time/CPM stored in database --> is it time to generate new graphs? If yes --> is the server busy? If no --> generates new graphs. That's simple enough. Times that by 330 stations equals 5.5 times every second at 60 second submission intervals. at 30 second intervals it would be 11 times a second. At 1 second intervals it would be 330 times a second. But that isn't realistic, so lets say 280 stations are 60 seconds, 40 stations are 30 seconds and 10 stations are 1 second. That would be 24 submissions a second, more than twice that if everyone submitted every 30 seconds. Every submission uses up IOPS, the DB uses up IOPS, every apache request is logged, more IOPS. And this is running on a RPi4 with an SD card. When the graphs are generated, say the 24 hour graph, it collates the last 24 hours of counts from the DB, then processes them to produce the graph PNGs. For 60 seconds submission intervals it would collate 1440 records to process and then make the PNG. 2880 records for 30 second intervals and 86400 records for 1 second intervals. The same for the other graphs. A large amount of data would have to be collated, then processed/averaged and plotted to the PNGs. I can only assume that 2880 records would take twice as long as 1440, thereabouts.
That's the performance side of it, in a nutshell. Now on to data growth. When I realised some users were submitting every second I looked at the database. One station's data table was over 20,000,000 records. Crunching the numbers at the time the growth was simply too much and too fast. At 60 seconds intervals it equates to 525,600 records a year. At 30 seconds it is just over 1,000,000. Users that have not donated have a data retention period of 2 years and those that have donated have 5 years. After those times, as new data is submitted, old records are removed. This regulates the database size, somewhat. It doesn't account for new stations coming online and when old stations go offline their data is retained as some stations will disappear for a while and then come back later. Looking at the database size now (14.4GB) it seems to be growing at about 1.2GB/year. This will be due to new stations coming along and old stations going offline. I can only see this increasing if things escalate with the war(s) that are going on right now, but 1.2GB/year is kind of manageable on a RPi4.
And that brings me on to why there is no bulk upload option. This isn't a data store to be used as that. It's purpose is to record live readings as they happen, put the numbers on a map and generate some graphs. Bulk upload would come under data manipulation IMHO, which both myself and mw0uzo are against. It would also give an open door to someone maliciously uploading a massive amount of data, potentially crashing the server. It could be cut up into small chunks to stop that, but that would just make the process messy.
Ultimately it is a tiny computer with tiny slow inefficient drives, stressed to the point it requires custom cooling to stop the PCU burning up and without limits being in place it would just fall flat, with it's CPU maxed 24/7, and the database would grow and so would the IOPS, and it would probably just fail. It's not likely to change either whilst running on RPi hardware. If it were a twin Xeon 12 core server with 32GB RAM and a bunch of SAS SSDs, things might be different. The upside is is uses virtually no power, and used to be run on solar until Dan (mw0uzo) moved.
If you are really keen on keeping a lot of high resolution data, I would suggest (if you haven't already) setting up your own web/MySQL/MQTT (or whatever flavour of software) server and record it locally. A few people have done this, myself included.
I know this doesn't help you much, but I hope it does answer your questions.
Please Log in or Create an account to join the conversation.
3 months 3 days ago #7523
by Simomax
Replied by Simomax on topic Radmon.org API rate limiting and mass upload feature
I'm curious about this - the 2 to 13 seconds bit. There are only two submit API functions and both should be governed by the 'no less than 30 seconds' limit. How did you manage to get it submit every 13 seconds? What API command were you using? Also the "API not available" message you state. That message isn't even in the core code. You should receive a message of 'Too soon' and nothing else. Unless you were submitting readings from the past, then I guess the submission time would be older than 30 seconds, in which case it might work. I don't know about this 'API not available' message though. That's not in code whatsoever.So I changed the values, increasing the delay from 2 to 13 seconds (not a divider of 60).
This works much better as now there are no more "API not available" answers anymore and the queue is emptying itself much faster and at a constant rate.
Please Log in or Create an account to join the conversation.
- geigermantes
-
Topic Author
- Offline
- New Member
-
Less
More
- Posts: 5
- Thank you received: 0
3 months 3 days ago #7524
by geigermantes
Replied by geigermantes on topic Radmon.org API rate limiting and mass upload feature
Thanks for the detailed answer. It certainly took me more than 60s to read it...
I'll try to answer both your posts at once.
From the first post:
I am posting the CPM values every 60s as they arrive with this periodicity from the geiger counter.
My question was more related to the backlog that accumulates when the API is not available: I store the values in a queue with their corresponding timestamp.
And I use the API with the datetime option to upload them retrospectively. The goal is to fill in the gaps that appear online in the charts.
To clear the backlog, I need to send the values faster than every minute, as new values come each minute as well, adding to the queue.
So, according to the radmon setup, I will just set the uploading every 30s when there are values in the queue; During normal operation the new values will arrive every minute anyway.
Or... not
In your fourth paragraph you said that radmon.org is more for instant values rather than historical.
Then should I bother posting missing historical data at all?
If it is only a system for real time values, then the backlog is not important.
From the last paragraph: yes, I also send the value to my Home Assistant server which will display an hourly graph that mimics the one from radmon.
Now onto your second post:
I have 2 graphs trying to explain what happens when I submit every 2 sec and 13 sec. They are from the Home Assistant dashboard and this is where I see if the uploading process is working.
Hopefully they are self explanatory. If not, I can provide more details.
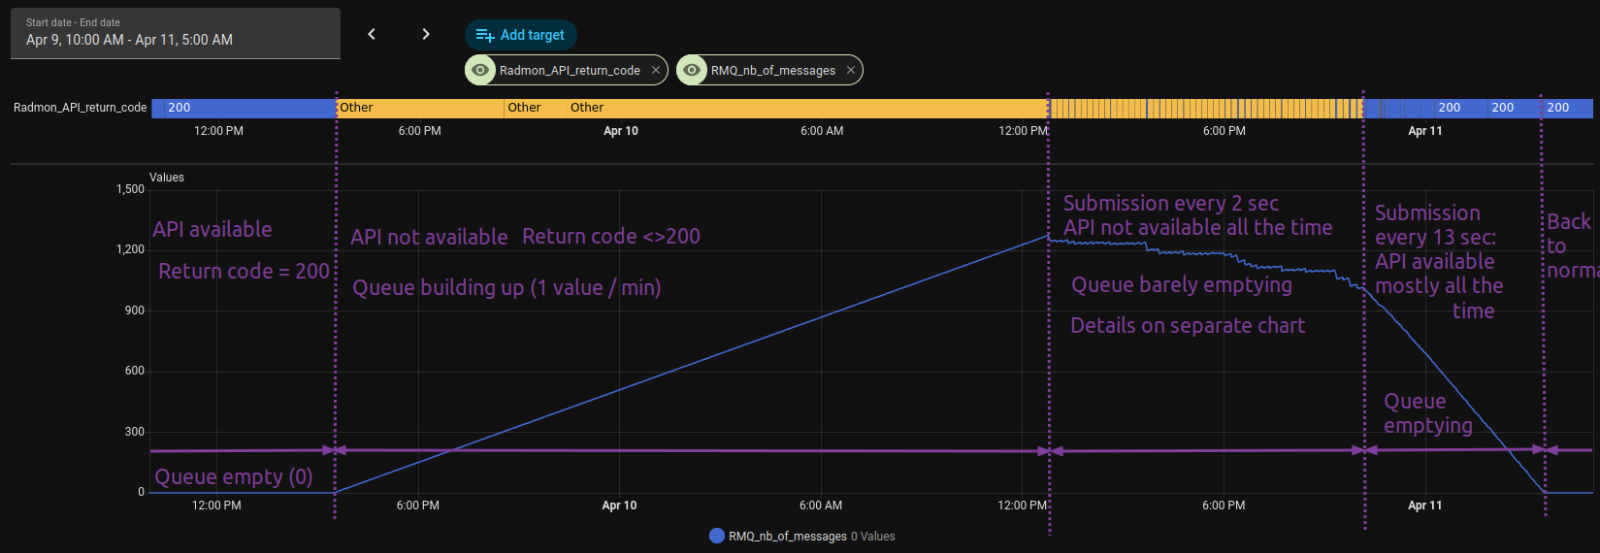
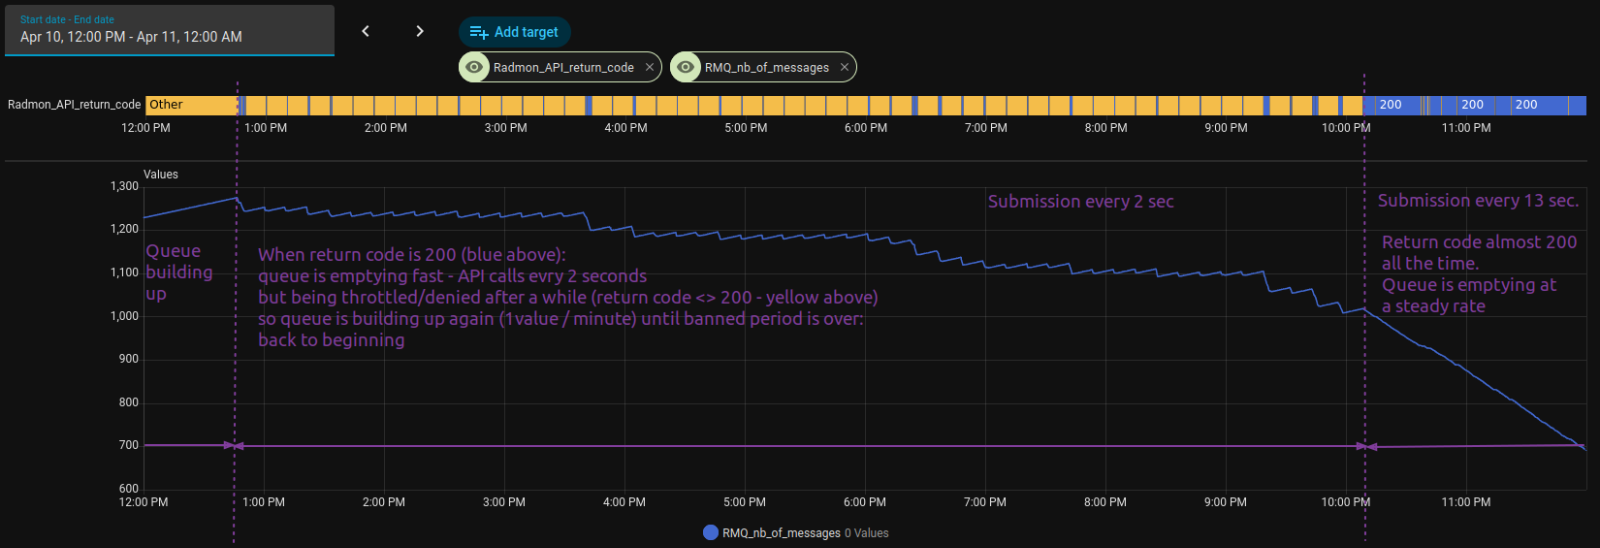
As for the error code, I catch it, but I don't store it. So I don't know what was exactly in the message.
I just check if the return code is different from 200 and if it is, that is what I call "API not available".
The value I was trying to upload is then put in a queue to be re-uploaded later.
As for the API call, I use the syntax with datetime:
http://radmon.org/radmon.php?function=submit&user=radmon_user&password=radmon_password&datetime=UTC_TS&value=CPM_value&unit=CPM"
Hope I have not missed anything.
I'll try to answer both your posts at once.
From the first post:
I am posting the CPM values every 60s as they arrive with this periodicity from the geiger counter.
My question was more related to the backlog that accumulates when the API is not available: I store the values in a queue with their corresponding timestamp.
And I use the API with the datetime option to upload them retrospectively. The goal is to fill in the gaps that appear online in the charts.
To clear the backlog, I need to send the values faster than every minute, as new values come each minute as well, adding to the queue.
So, according to the radmon setup, I will just set the uploading every 30s when there are values in the queue; During normal operation the new values will arrive every minute anyway.
Or... not
In your fourth paragraph you said that radmon.org is more for instant values rather than historical.
Then should I bother posting missing historical data at all?
If it is only a system for real time values, then the backlog is not important.
From the last paragraph: yes, I also send the value to my Home Assistant server which will display an hourly graph that mimics the one from radmon.
Now onto your second post:
I have 2 graphs trying to explain what happens when I submit every 2 sec and 13 sec. They are from the Home Assistant dashboard and this is where I see if the uploading process is working.
Hopefully they are self explanatory. If not, I can provide more details.
As for the error code, I catch it, but I don't store it. So I don't know what was exactly in the message.
I just check if the return code is different from 200 and if it is, that is what I call "API not available".
The value I was trying to upload is then put in a queue to be re-uploaded later.
As for the API call, I use the syntax with datetime:
http://radmon.org/radmon.php?function=submit&user=radmon_user&password=radmon_password&datetime=UTC_TS&value=CPM_value&unit=CPM"
Hope I have not missed anything.
Attachments:
Please Log in or Create an account to join the conversation.
3 months 2 days ago - 3 months 2 days ago #7527
by Simomax
Replied by Simomax on topic Radmon.org API rate limiting and mass upload feature
You haven't missed anything, and you do explain things better, so I completely understand what you are trying to do now. In all honesty, this is the first time this has ever come up, but I see your point. Carry on trying to fill in the gaps as you are every 13 seconds and see what happens. I'm loath to remove the rate limit as someone will take advantage - probably without realizing.
This has always been an issue when radmon.org goes down since it's launch back in 2014/2015. Most of the submissions come from small devices (ESP32/8266/RPi) and they are mainly fire and forget so for the majority of users there is no way to fill in the gaps. I'll have a think about it, and if anyone has any suggestions how this can be accomplished with keeping the rate limit in place then please let me know. I don't need any code or anything, just the idea.
So with all that in mind, does the history here mean anything? It makes for pretty graphs, but can only really give any credible data to the owner of the station as the owner would be the only person aware of what went on at the given time. I (and other users) have seen the odd thing that is interesting, such as a bunch of stations around the same area, but probably 10's if not 100's of miles apart that showed a small peak all around the same time. The last time I saw this, the stations had only peaked by a few CPM, mine was one of them (in Blackpool UK) yet another was in Netherlands, so considerably far apart. What was that? I haven't a clue, but as it only persisted for an hour or so, and was only +5 CPM more, it is negligible. I could go on, but I think you get the point. If there was ever a Chernobyl/Fukushima size event that happened today it would be interesting to see if/what stations picked up and if it made any sense. I think the only thing the history would be good for is some kind of large event that actually made a few stations sing, but until that happens (let's hope not) it is just a bunch of hobbyist stations getting clicks from wherever.
So in essence, use radmon.org however you want to, within the bounds of the system itself.
This has always been an issue when radmon.org goes down since it's launch back in 2014/2015. Most of the submissions come from small devices (ESP32/8266/RPi) and they are mainly fire and forget so for the majority of users there is no way to fill in the gaps. I'll have a think about it, and if anyone has any suggestions how this can be accomplished with keeping the rate limit in place then please let me know. I don't need any code or anything, just the idea.
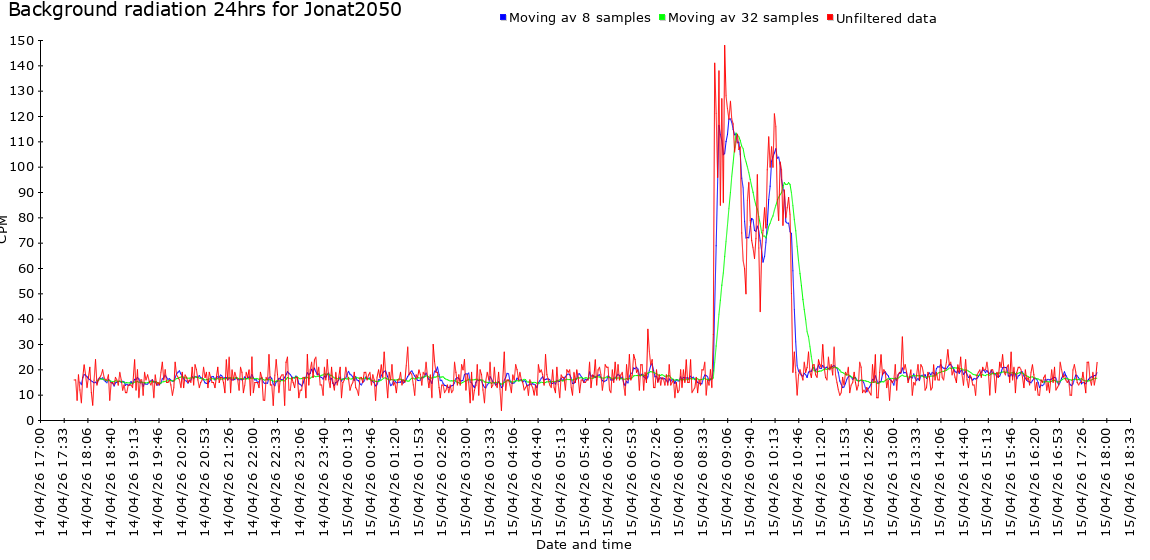
That's my opinion, and the way I use radmon.org. I have always stored the data locally for my counters and being local they aren't susceptible to radmon.org going down. My honest opinion is the data that is gathered on any station on radmon.org shouldn't be relied upon in any way other than interest. Probably all of the counters submitting to radmon.org are toys compared to the proper radiation monitors scattered about the world. There was an instance not so long back (all over twitter/X) where some training exercise radiation data made it's way on to windy.com. It shouldn't have, and was due to an admin error. Twitter/X went alight with theories and people were posting radmon.org stations - (paraphrasing) "Look at this site, it is 1000cpm!!!!", or "OMG, it is drifting, see this monitor, you can see the radiation increasing on it! Panic!" I looked into this when it happened and it was a simple mistake where fake (training) data had been released by accident, and compounded by ambiguous radmon.org/GMC radiation data. All you have to do is check the 'alerts full' page and you will see many 'junk' readings. They may be experiments, or simply people just playing about with their radioactive sources whilst still submitting. This graph below says a lot and nothing at all. (sorry Jonat2050, I'm not picking on you, but you were the last one to alert, so top of the page). What is the spike? Is it real, is it something else? There is nothing more to be had from that except it peaked, then dropped off. Why? It's anyone's guess. Jonat2050 may know, or even may not. Could be interference, or a glass tube catching some daylight if it is one of the light sensitive tubes. Now imagine if there was a real radiation release somewhere and a couple of counters close to the original detection went awry, peaked around the same time. They can't be relied on. Now imagine if these radmon stations were south of the radiation release, but the wind was blowing north. People would look here and assume it is going south and cause confusion.In your fourth paragraph you said that radmon.org is more for instant values rather than historical.
Then should I bother posting missing historical data at all?
If it is only a system for real time values, then the backlog is not important.
So with all that in mind, does the history here mean anything? It makes for pretty graphs, but can only really give any credible data to the owner of the station as the owner would be the only person aware of what went on at the given time. I (and other users) have seen the odd thing that is interesting, such as a bunch of stations around the same area, but probably 10's if not 100's of miles apart that showed a small peak all around the same time. The last time I saw this, the stations had only peaked by a few CPM, mine was one of them (in Blackpool UK) yet another was in Netherlands, so considerably far apart. What was that? I haven't a clue, but as it only persisted for an hour or so, and was only +5 CPM more, it is negligible. I could go on, but I think you get the point. If there was ever a Chernobyl/Fukushima size event that happened today it would be interesting to see if/what stations picked up and if it made any sense. I think the only thing the history would be good for is some kind of large event that actually made a few stations sing, but until that happens (let's hope not) it is just a bunch of hobbyist stations getting clicks from wherever.
So in essence, use radmon.org however you want to, within the bounds of the system itself.
Attachments:
Last edit: 3 months 2 days ago by Simomax.
Please Log in or Create an account to join the conversation.
Moderators: Gamma-Man
Time to create page: 0.179 seconds