
×
RadLog
Novice Questions
7 years 4 months ago - 7 years 4 months ago #4351
by GetSirius
Mineral Point radiation/lightning monitor: getsirius.com/radiation
Novice Questions was created by GetSirius
Just starting with RadMon Software and website. So far, I like it. Looking to obtain an inexpensive laptop to dedicate for RadMon. Have a few questions.. Using RadLog 0.43
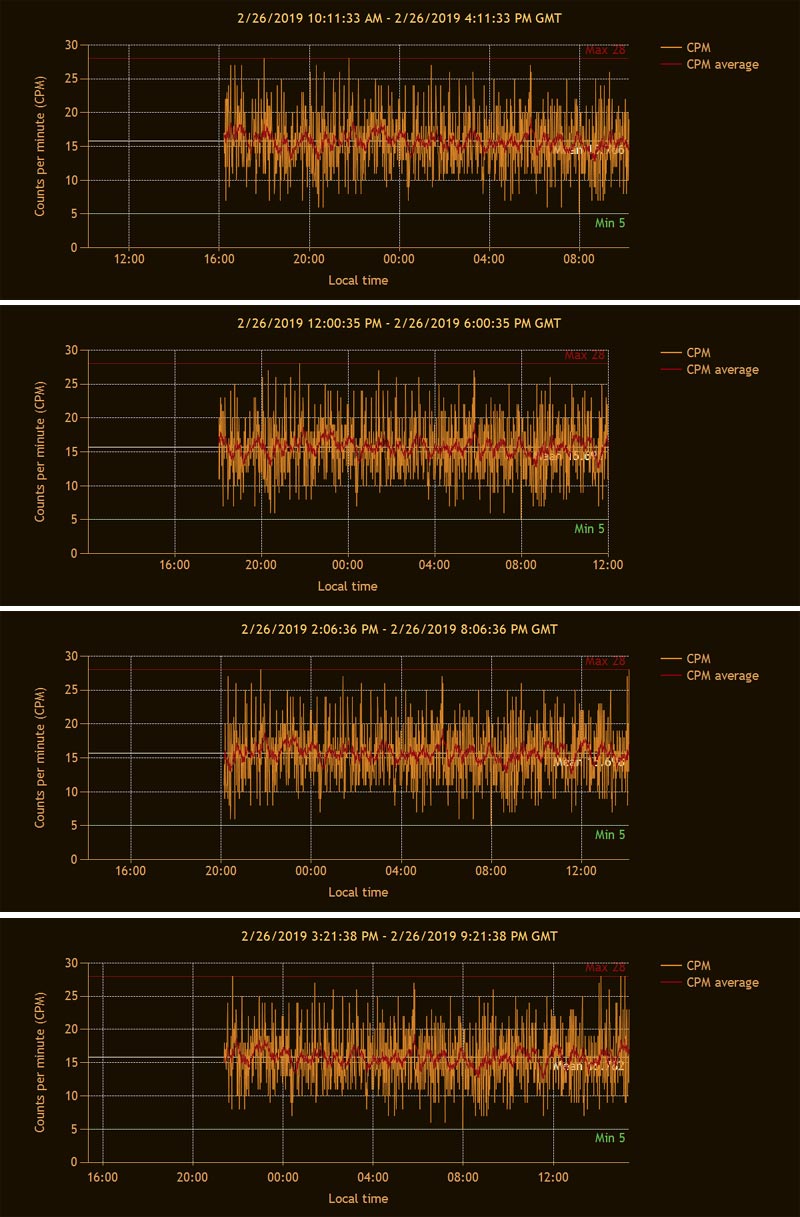
I have software set up to upload graph images to my website. In Graph Options, I have Log Interval set for 24 hours. It does not appear that the graph is working properly. Data gets cut off at about 18 hours. Please see the attached image to see what I am talking about. I know I can get a 24 graph at RadMon, but I like my colors and like hosting such things on my own site.
In Network, I am having issues with uploading the other available data. I have upload checked for all data that says it is for log purposes. I tried to use filenames like "<date>_<time>_RawData.txt" but the <date> and <time> do not appear to work. They are uploaded just as "<date>_<time>", not numbers. Maybe these are not intended to be archives?
Also, for the log data, how often is that supposed to upload? It has only happened two times over the past three days. Is there a way to control how often this happens?
On the RadMon world map, what is the meaning of the different colors for stations. I see most are a bright green, I suspect they are operating normally. Yellow I understand to be a high reading. What is the gray and dark green stations (I am dark green). May be helpful for others if that info is put on the home page under the map.
Enough for now. Thank you in advance for any help offered!
Chuck, NX9V, Mineral Point, WI. USA
Mineral Point radiation/lightning monitor: getsirius.com/radiation
Last edit: 7 years 4 months ago by GetSirius. Reason: add software version
Please Log in or Create an account to join the conversation.
7 years 4 months ago #4352
by GetSirius
Mineral Point radiation/lightning monitor: getsirius.com/radiation
Replied by GetSirius on topic Novice Questions
I think I found my answer for the graph cutting data off in "Problem with RadLog graph" It appears to be adding data to the end of the graph now that I set the time for UTC. Would prefer local time, but this works..
Mineral Point radiation/lightning monitor: getsirius.com/radiation
Please Log in or Create an account to join the conversation.
7 years 4 months ago #4356
by Bert490
Replied by Bert490 on topic Novice Questions
Hi Chuck, welcome.
For the icon colors, dark green means you have set 'alert enable' OFF on your website Profile (top right). This prevents yellow and red on the world map and stops any email alerts you may have set up in Radlog. It is used for experiments, source checks, or calibrations. It used to be within Radlog in version 0.42 (called 'Experiment mode'), but since emails and map colors are sent by the server, it was moved to the server side.
I just noticed that the warning and alert levels also now appear on the web server under Profile. For anyone seeing their icons red or yellow frequently, this would be the place to update these thresholds.
Please Log in or Create an account to join the conversation.
7 years 4 months ago - 7 years 4 months ago #4358
by mw0uzo
Replied by mw0uzo on topic Novice Questions
I'll check the RadLog source later to see what the tags are for the ftp log history. Half term here this week, so running around after kids. In the meantime, try <datetime>
Last edit: 7 years 4 months ago by mw0uzo.
Please Log in or Create an account to join the conversation.
7 years 4 months ago - 7 years 4 months ago #4362
by mw0uzo
Replied by mw0uzo on topic Novice Questions
Ok there are only a few tags that work here
<datetime>
<localdatetime>
<version>
I guess there should be more really, so as you're trying to set up an archive I can implement your suggestions in the new version that supports GMC500 counter.
These uploads happen at the end of each major sampling period, e.g. every 3 hours.
<datetime>
<localdatetime>
<version>
I guess there should be more really, so as you're trying to set up an archive I can implement your suggestions in the new version that supports GMC500 counter.
These uploads happen at the end of each major sampling period, e.g. every 3 hours.
Last edit: 7 years 4 months ago by mw0uzo.
The following user(s) said Thank You: GetSirius
Please Log in or Create an account to join the conversation.
7 years 4 months ago - 7 years 4 months ago #4363
by GetSirius
Mineral Point radiation/lightning monitor: getsirius.com/radiation
Replied by GetSirius on topic Novice Questions
Thank you for the help!
I think I was seeing the same problem that was discussed in "Problem with RadLog graph" on my 0.43 version. Data being cut off the old end of the graph. The original post shows what I was seeing. I am GMT-6 and unchecking the GMT box cured the problem. Not a big deal, but local time would be a nice touch.
I think I was seeing the same problem that was discussed in "Problem with RadLog graph" on my 0.43 version. Data being cut off the old end of the graph. The original post shows what I was seeing. I am GMT-6 and unchecking the GMT box cured the problem. Not a big deal, but local time would be a nice touch.
Mineral Point radiation/lightning monitor: getsirius.com/radiation
Last edit: 7 years 4 months ago by GetSirius.
Please Log in or Create an account to join the conversation.
Moderators: Gamma-Man
Time to create page: 0.173 seconds