
- Forum
- General chat
- General discussion
- Can I trust that my Geiger counter (GQ GMC 500) is in fact measuring radiation?
Can I trust that my Geiger counter (GQ GMC 500) is in fact measuring radiation?

1 year 2 months ago #7399
by Radman_L
Replied by Radman_L on topic Can I trust that my Geiger counter (GQ GMC 500) is in fact measuring radiation?
Thanks, Simomax, This is quite the explanation. Yes, I did purchase the Radiacode. After a week of using it in the house, I picked up the following list of isotopes, ranging from high to low counts (Enough data has accumulated to distinguish between peaks and background). Note that I did not include all the emission lines of these isotopes.
Iodine-131 82k
Lu-176 84k
LU 177 22k
Sm-153 78 k
Am-241 67k
Eu-152. 10 k
Tc-99. 45 k
Pb-210 Chain Ra-226. 37 k
U-235 Chain U(235-238) 28 k
Ba-133 40 k
Pb-212 15 k
Pb-214 Chain Ra-226 7.5 k
Ac-228 Chain Th-232 4.25 k
Annhiliation Line 1.5 k
Kr-85. 1.25 k
Ti-208 Chain Th-232 1k
Bi-214 Chain Ra-226 950
Cs-137 700
Bi-212 Chain Th-232 600
Pa-234 Chain U(235-238) 550
Sc-44 Chain Ti-44 300
Co-60 300
K-40. 200
The most obvious peaks are a big peak made up of the higher count isotopes, then K-40, and then Ti-208, Chain Th 232, 2614 kev. Emerging peaks are from Bi-214, of which there are a few, an SC-44/Co-60 combined? emerging peak, and AC-228. Ti-208 also shows up a little earlier at 583 keV at the noted 1k count.
I'll try to give a reply to your other points tomorrow.
Please Log in or Create an account to join the conversation.
1 year 2 months ago #7400
by Simomax
Replied by Simomax on topic Can I trust that my Geiger counter (GQ GMC 500) is in fact measuring radiation?
This is great as you can share the spectrum. Please post your xml file so I can take a look at it and compare to my background captures. You list so many isotopes that I can only assume this is background, but if you upload your xml file for the capture, I can compare against other captures I have already.Yes, I did purchase the Radiacode. After a week of using it in the house, I picked up the following list of isotopes
Please Log in or Create an account to join the conversation.
1 year 2 months ago #7401
by Radman_L
Replied by Radman_L on topic Can I trust that my Geiger counter (GQ GMC 500) is in fact measuring radiation?
Okay, I've attached the XML file. Please let me know if did this correctly.
Please Log in or Create an account to join the conversation.
1 year 2 months ago #7402
by Simomax
Replied by Simomax on topic Can I trust that my Geiger counter (GQ GMC 500) is in fact measuring radiation?
That's great, Radman_L. Yes, you did that correctly - nice work. I have taken a look at your spectrum, and I see you are using a Radiacode 102 and the collection was done over 9 days 15 hours. There is a nice peak at 1461 keV (K-40) and this is bang on in the right place. This tells me your RC-102 is calibrated well. First of all, disregard anything below around 100 keV. This huge peak is caused by Bremsstrahlung from beta emitters, internal detector noise and possible x-rays from radon decay progeny. I have a 101 and a 103 and I have seen this on many every other Radiacode spectra and the peak in your spectrum is textbook Radiacode spectra in this range. It is most likely due to the small sensor SPiM detector and mostly internal noise (I'll have a much better idea about this when I make a shielded chamber.) Essentially this is a trait akin to Radiacodes and other small cheap scintillators. Ignore anything <100 keV.
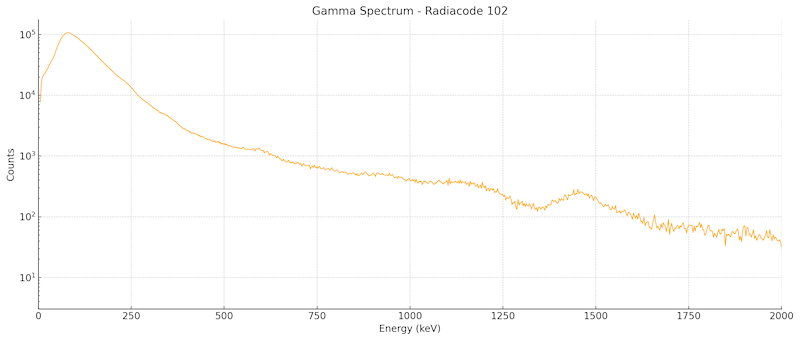
Then onto the other small lumps and bumps around 242 keV, 352 keV, 609 keV, 1120 keV and 1764 keV. This looks like Radon decay. Also a bit of a scattered bump around 2614 keV suggests Thorium decay. I know you are in Leiden, Netherlands and that is a very low Radon area, so I am ruling that out for this capture. Looks like NORM to me. If this was Radon only, there would be very little around 2614 keV. So this is showing a little Thorium decay too, add the radon decay (likely from natural uranium 238) and I would put my money on it being NORM, probably from the building itself and surrounding constructions.
After my analysis of the spectrum I fed it to Lala (ChatGPT AI) and Lala came back with exactly the same conclusion as I did. Lala also worked out the estimated dose rate to be 0.037 µSv/h which is perfectly normal. I asked Lala to calculate the yearly dose based on your spectrum and it came back with 0.32 mSv/year. The world average is 2.4 mSv/year, so you are well below that, and would tie in with your low radon area. I also asked Lala to recheck the yearly rate against the spectrum data (as it just used it's calculated dose rate of 0.037 µSv/h.) This came back as 0.0370 µSv/h dose rate and 0.324 mSv/year annual dose. Belt and braces confirmed.
Conclusion: Your spectrum is perfectly normal, showing signs of natural radiation decay. Your levels are low, and well below the yearly average. If something is making you ill, it is not radiation. If is makes you feel any better (it may not), the radiation levels in my office are higher than what you are getting with your Radiacode - Dose Rate: 0.041 µSv/h and annual Dose Estimate: 0.36 mSv/year for my office, here is Blackpool, UK.
I have attached the full ChatGPT conversation (includes all analysis) to this post.
The following user(s) said Thank You: Juzzie
Please Log in or Create an account to join the conversation.
1 year 2 months ago #7403
by Simomax
Replied by Simomax on topic Can I trust that my Geiger counter (GQ GMC 500) is in fact measuring radiation?
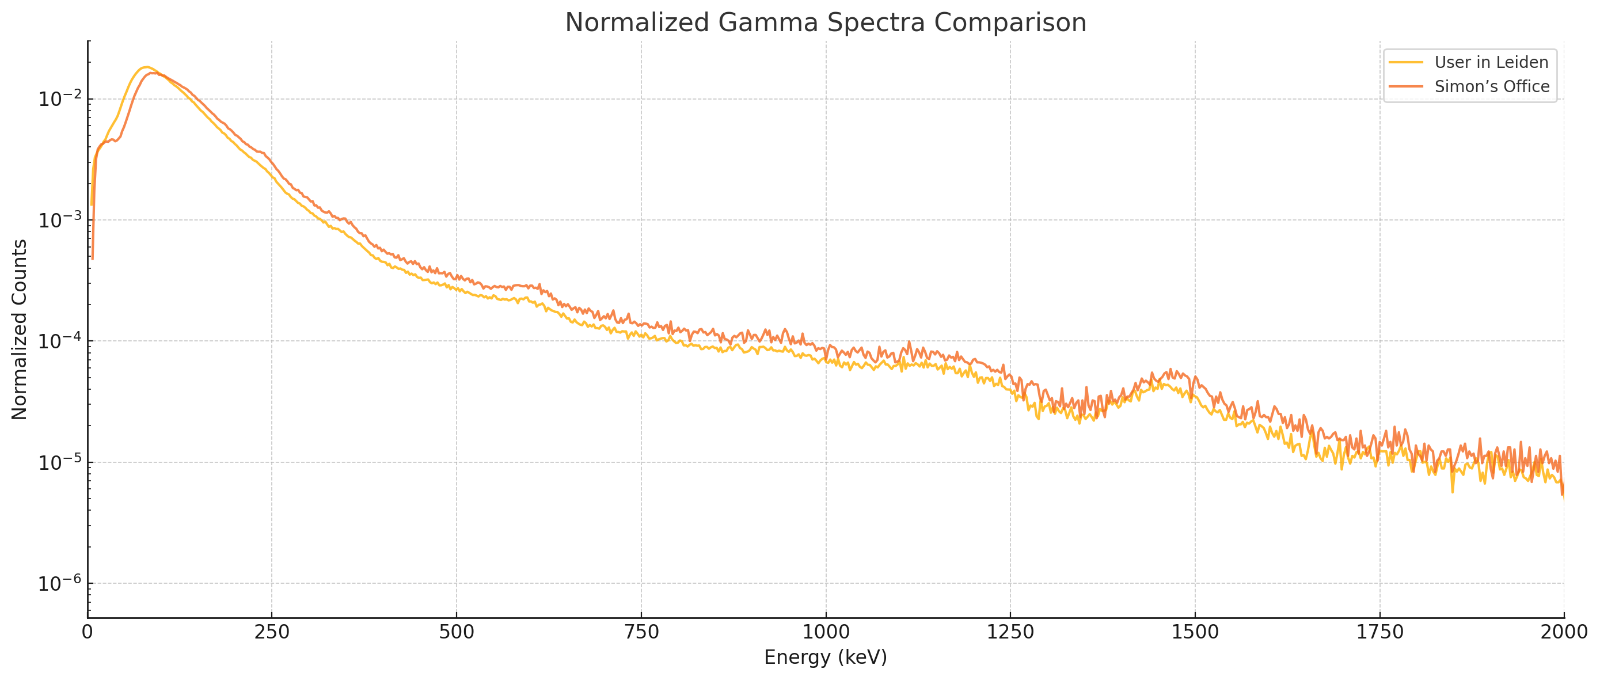
Just a little more on this. I have compared my background with your spectrum, Lala analysed it - comments below.
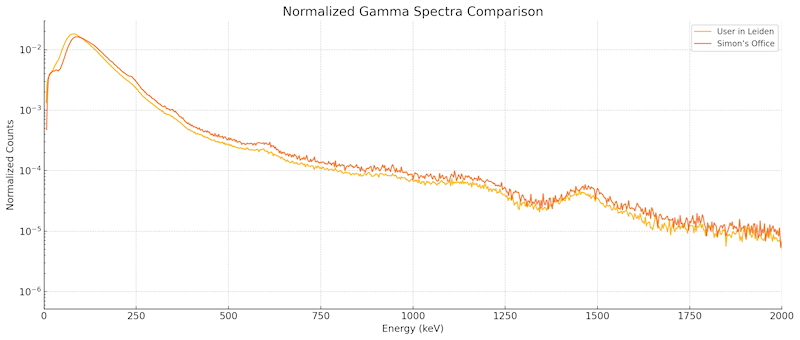
The full resolution plot is attached below.[ChatGPT]
As predicted, the spectra are remarkably similar—both show:
The full resolution plot is attached below.[ChatGPT]
As predicted, the spectra are remarkably similar—both show:
- A broad low-energy rise (detector noise, bremsstrahlung, or low-energy X-rays),
- A clear K-40 peak at ~1460 keV,
- Smaller bumps consistent with radon progeny (Pb-214, Bi-214),
- And faint traces around 2614 keV (Tl-208), suggesting thorium decay.
Please Log in or Create an account to join the conversation.
Moderators: Gamma-Man
- Forum
- General chat
- General discussion
- Can I trust that my Geiger counter (GQ GMC 500) is in fact measuring radiation?
Time to create page: 0.232 seconds